The chart below shows how much money is spent in the budget on different sectors by the UAE government in 2000.
Summarize the information by selecting and reporting the main features, and make comparisons where relevant.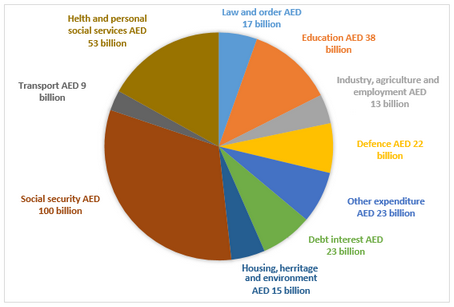
The charts below show the growth in the population in some of the world’s largest cities as well as the population distribution in urban and rural areas.
Summarize the information by selecting and reporting the main features, and make comparisons where relevant.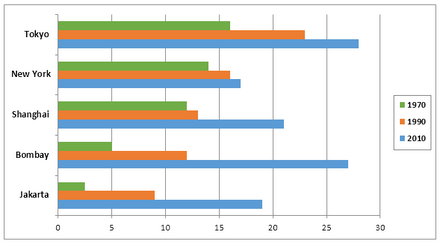
The average prices per kilometre of clothing imported into the European Union from six different countries in 1993 and 2003 are shown in the bar chart below.
Summarize the information by selecting and reporting the main features, and make comparisons where relevant.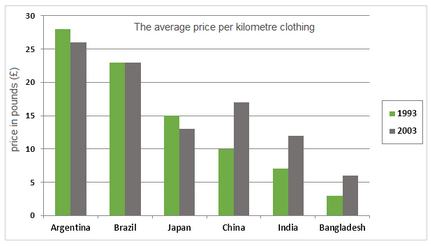
No comments:
Post a Comment